
Spring Boot Actuator provides powerful production-ready features for monitoring and managing applications, offering an impressive set of endpoints to inspect application state, health, configuration, and more. This article will cover these essential endpoints, giving you practical examples and insights into their usefulness in real-world applications.
Benefits of Using Spring Boot Actuator
Actuator is popular among developers for its convenience in managing applications at runtime. Its primary benefits include:
- Simplified monitoring with built-in endpoints.
- Real-time health checks for system status.
- Detailed visibility into application metrics.
- Easy integration with external monitoring systems.
Setting Up Actuator in Your Spring Boot Application
To enable Actuator, add the following dependency to your pom.xml file:
<dependency>
       <groupId>org.springframework.boot</groupId>
       <artifactId>spring-boot-starter-actuator</artifactId>
</dependency>
After including the dependency, Actuator’s endpoints are automatically available at /actuator However, you can customize this path if necessary.
Overview of Actuator Endpoints
The actuator provides multiple endpoints, each tailored to a specific purpose. They allow you to monitor and control different aspects of your application’s state, environment, configurations, and performance.
Actuator Endpoints Explained
Let’s dive into the most commonly used Actuator endpoints and their purposes, along with examples to show how they work.
The /info Endpoint
The /info endpoint provides basic information about your application, which you can customize with metadata like version numbers or environment-specific details.
Example:
To add custom information, add properties to your application.yml:
info:
 app:
  name: "My Application"
    version: "1.0.0"
When you access /actuator/info, the response might look like this:
{
 "app": {
 "name": "My Application",
 "version": "1.0.0"
}
}
The /health Endpoint
The /health endpoint checks the status of the application and its dependencies, making it ideal for health checks in deployment environments.
Example:
Accessing /actuator/health typically returns:
{
"status": "UP",
"components": {
"diskSpace": {
"status": "UP",
"details": {
"total": 499963174912,
"free": 261674819584,
"threshold": 10485760
}
}
}
}
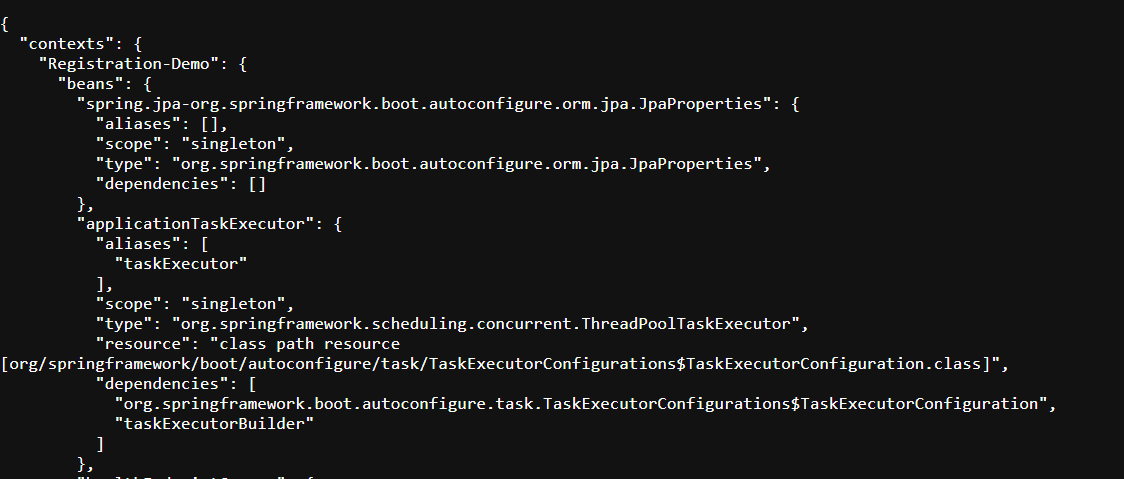
The /beans Endpoint
The /beans endpoint lists all Spring beans in the application context, useful for understanding bean dependencies and configurations.
Example:
Accessing /actuator/beans will return a large JSON structure detailing each bean, its class type, and its dependencies.
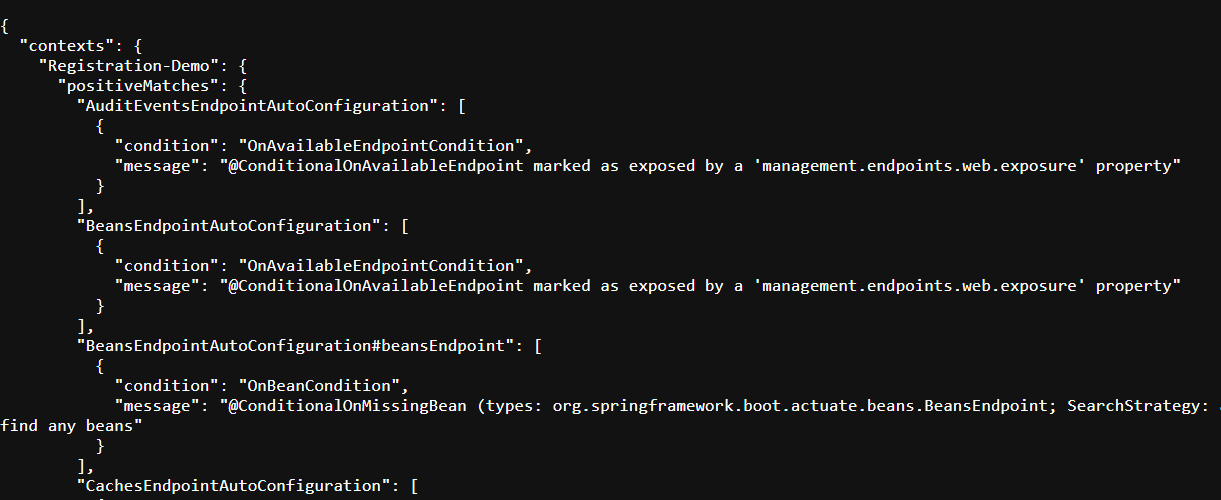
The /conditions Endpoint
The /conditions endpoint provides information on conditions that determine which beans and configurations were included in the application context.
Example:
A response from /actuator/conditions can help in troubleshooting conditional configurations and autowiring issues in complex Spring setups.
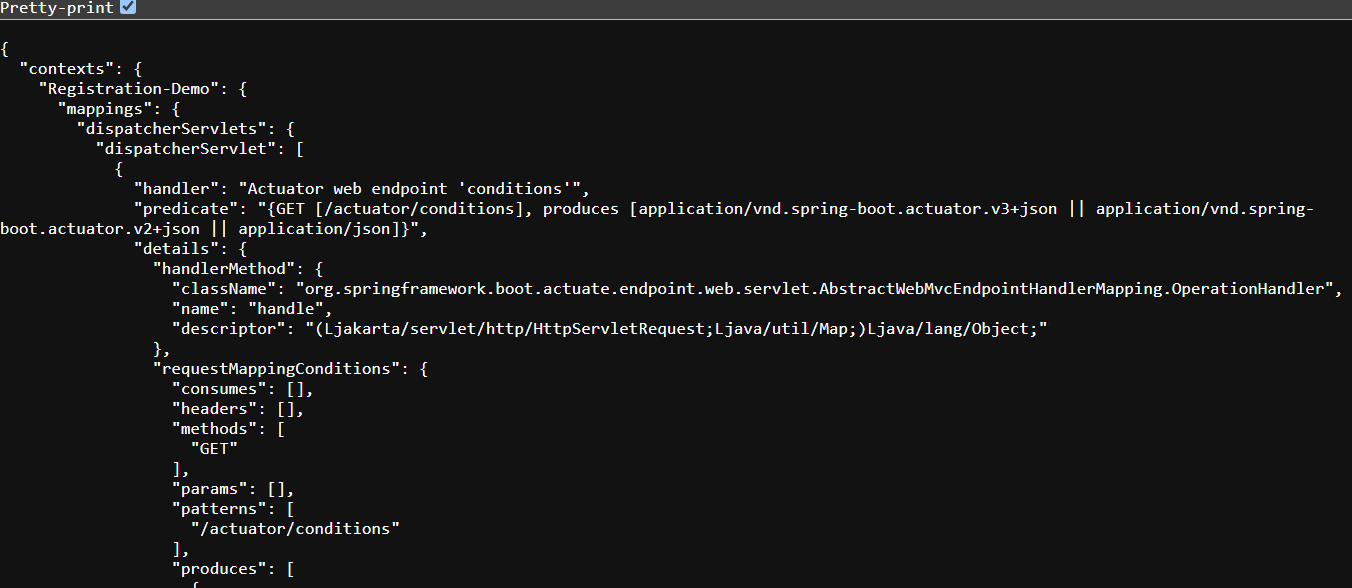
The /mappings Endpoint
The /mappings endpoint lists all the request mappings in the application, useful for understanding how routes are defined and handled.
Example:
A request to /actuator/mappings returns JSON data showing each URL path and the associated controller or handler method.
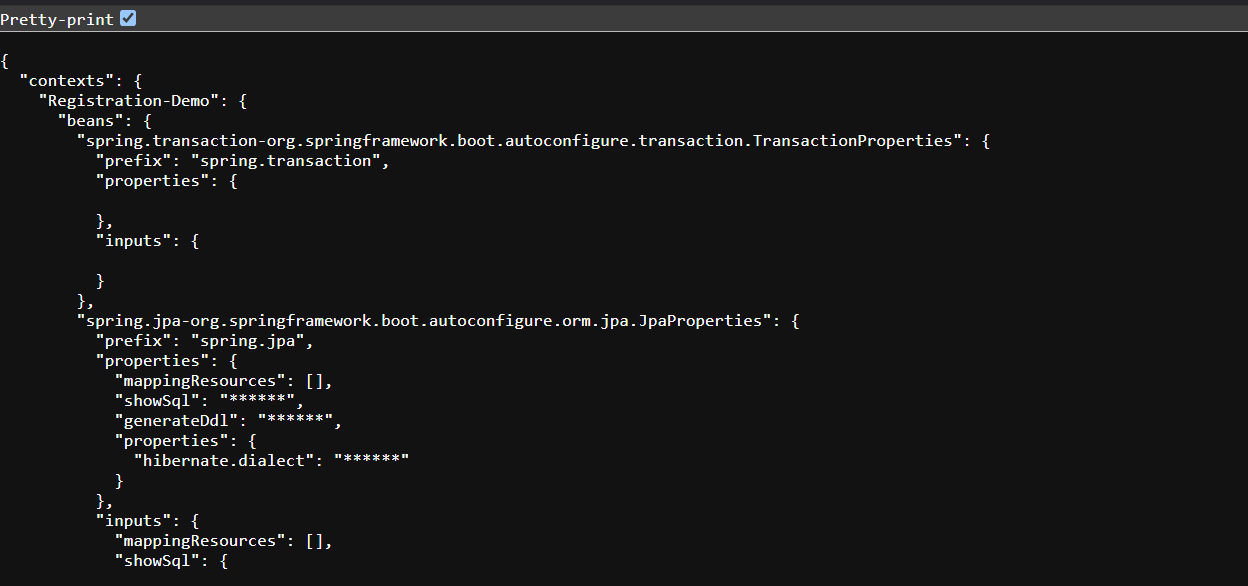
The /configprops Endpoint
The /configprops endpoint displays all configuration properties, showing the properties that Spring has configured and their values.
Example:
Using /actuator/configprops helps ensure that configuration properties are correctly set up and assists in troubleshooting configuration issue
The /metrics Endpoint
The /metrics endpoint is one of the most powerful, providing insights into various metrics like memory, CPU usage, and application-specific data.
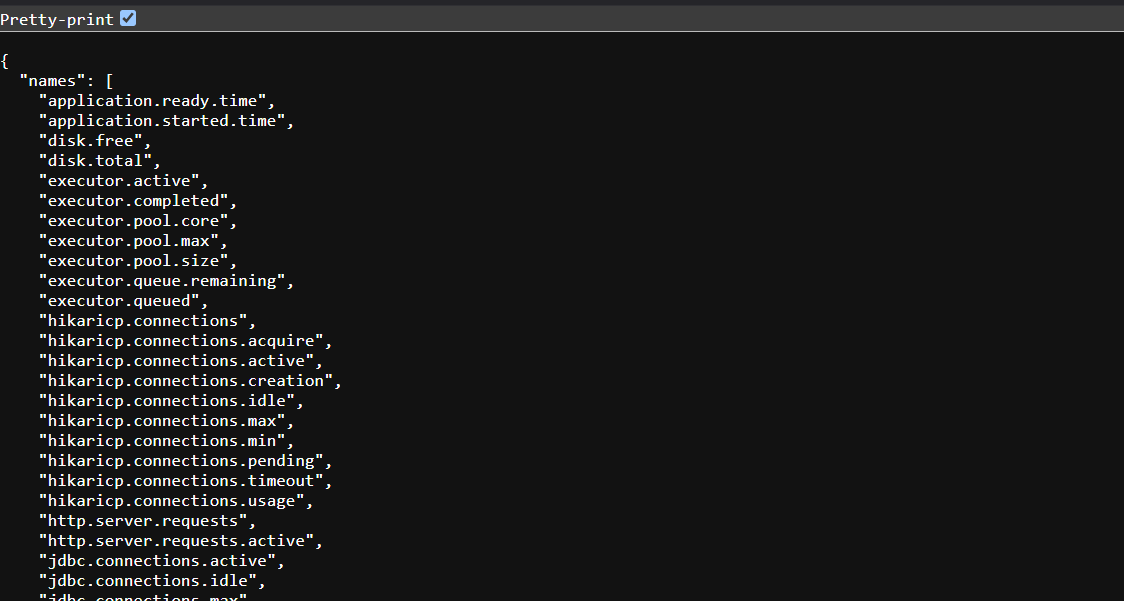
Specific metrics can be queried by appending metric names, such as /actuator/metrics/http.server.requests
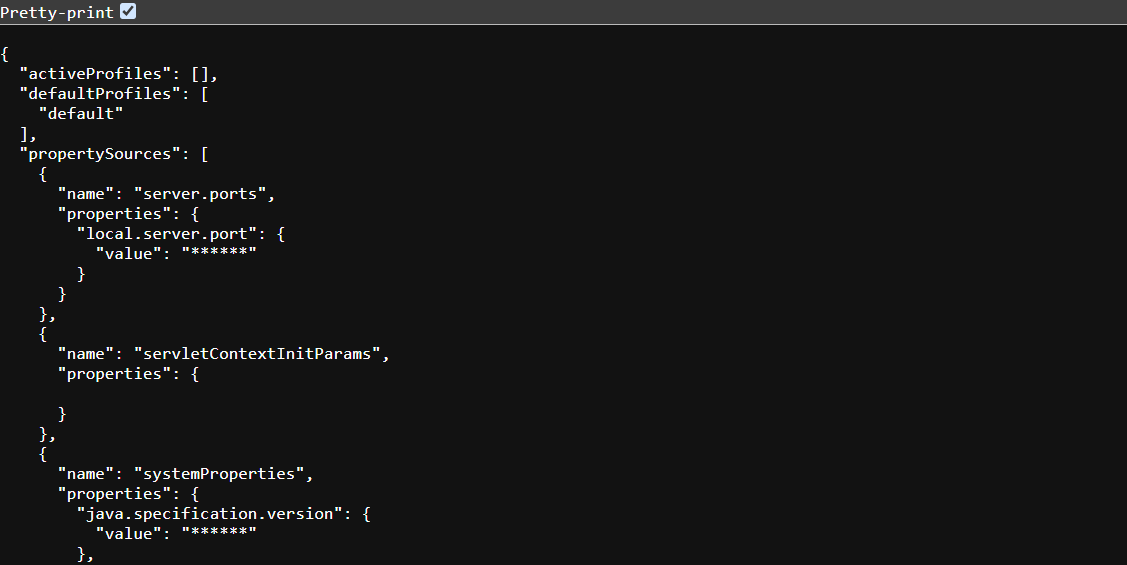
The /env Endpoint
The /env endpoint provides access to environment properties, including system properties and configuration properties. This endpoint is beneficial for debugging configuration issues.
Example:
Access /actuator/env to view all environment variables:
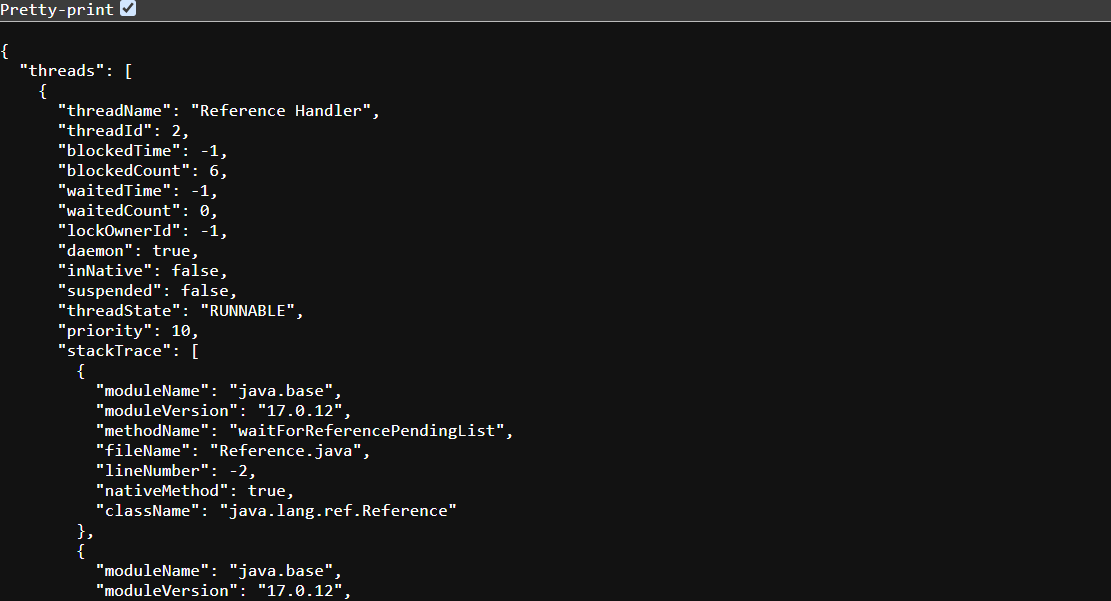
The /threaddump Endpoint
The /threaddump endpoint generates a thread dump for the application, which is invaluable for diagnosing performance bottlenecks or deadlocks.
Example:
Accessing /actuator/threaddump provides details on active threads and their states.
The /loggers Endpoint
The /loggers endpoint provides control over the logging levels for various parts of the application, allowing you to modify logging behavior dynamically.
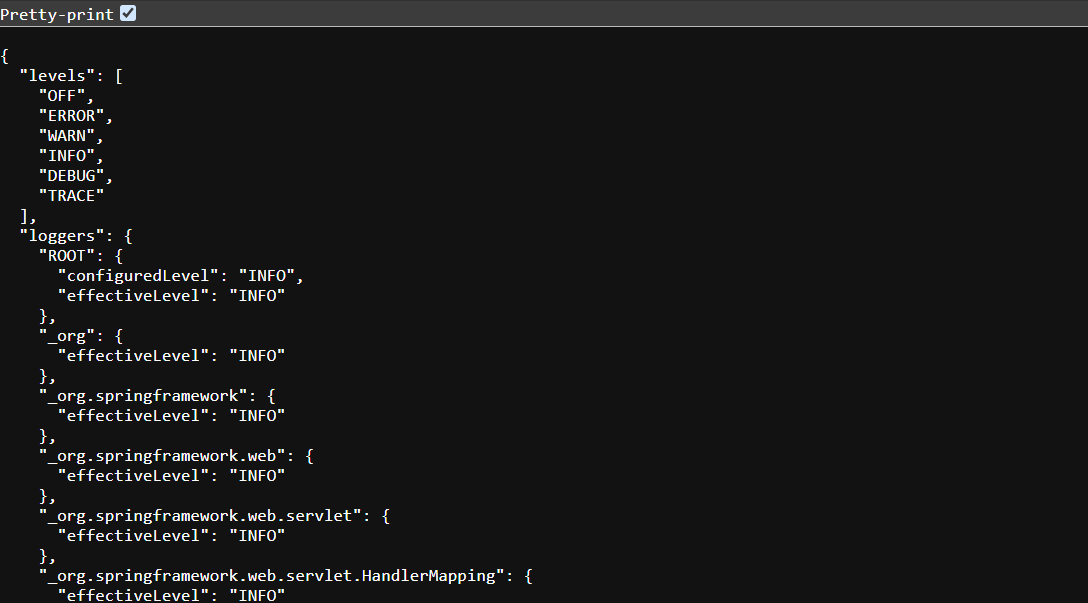
You can also change the log level of specific loggers by sending a POST request /actuator/loggers/{loggerName}
Security and Customization of Actuator Endpoints
By default, sensitive endpoints are restricted. To secure endpoints, use Spring Security or customize which endpoints are available in the application.yml:
management:
 endpoint:
  health:
   show-details: "always"
endpoints:
 web:
  exposure:
    include: "*"
Using Actuator Endpoints for Application Insights
Actuator’s endpoints provide visibility into application health, configuration, and resource usage. They allow developers to catch potential issues early, making maintenance easier.
Integrating Actuator with External Monitoring Tools
Spring Boot Actuator integrates seamlessly with tools like Prometheus and Grafana, enhancing monitoring and visualization capabilities by providing metrics that external tools can consume.
Optimizing Application Performance with Actuator
Using endpoints like /metrics, /threaddump, and /loggers, you can analyze resource usage, troubleshoot application slowness, and dynamically adjust logging levels for better performance insights.
Conclusion
Spring Boot Actuator is essential for monitoring, managing, and understanding the inner workings of your application. With its broad set of endpoints, developers can gain deep insights, optimize performance, and troubleshoot issues, making it a valuable tool for any production environment.
Interview Based Questions
1. What is Spring Boot Actuator used for?
Actuator offers built-in endpoints that help monitor, manage, and optimize Spring Boot applications in real time.
2. How do I enable Spring Boot Actuator endpoints?
Add the Actuator dependency to your project and configure available endpoints in your application’s configuration file.
3. Can I secure Actuator endpoints?
Yes, you can secure endpoints with Spring Security and control which endpoints are exposed using configuration properties.
4. How do I monitor custom metrics?
Spring Boot Actuator allows you to define and expose custom metrics by creating MeterRegistry instances in your application code.
5. Which endpoints are most important for production monitoring?
The /health, /metrics, and /loggers endpoints are commonly used for production monitoring as they provide insights into application health, performance, and logging.


